Marking water levels with coloured ribbons
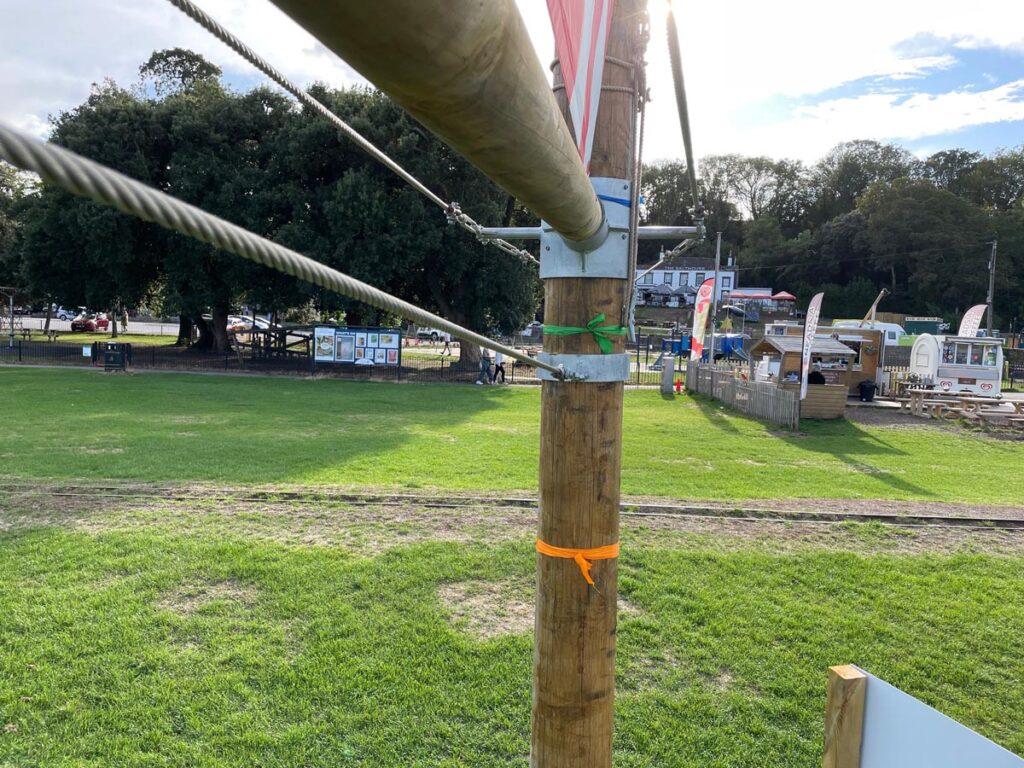
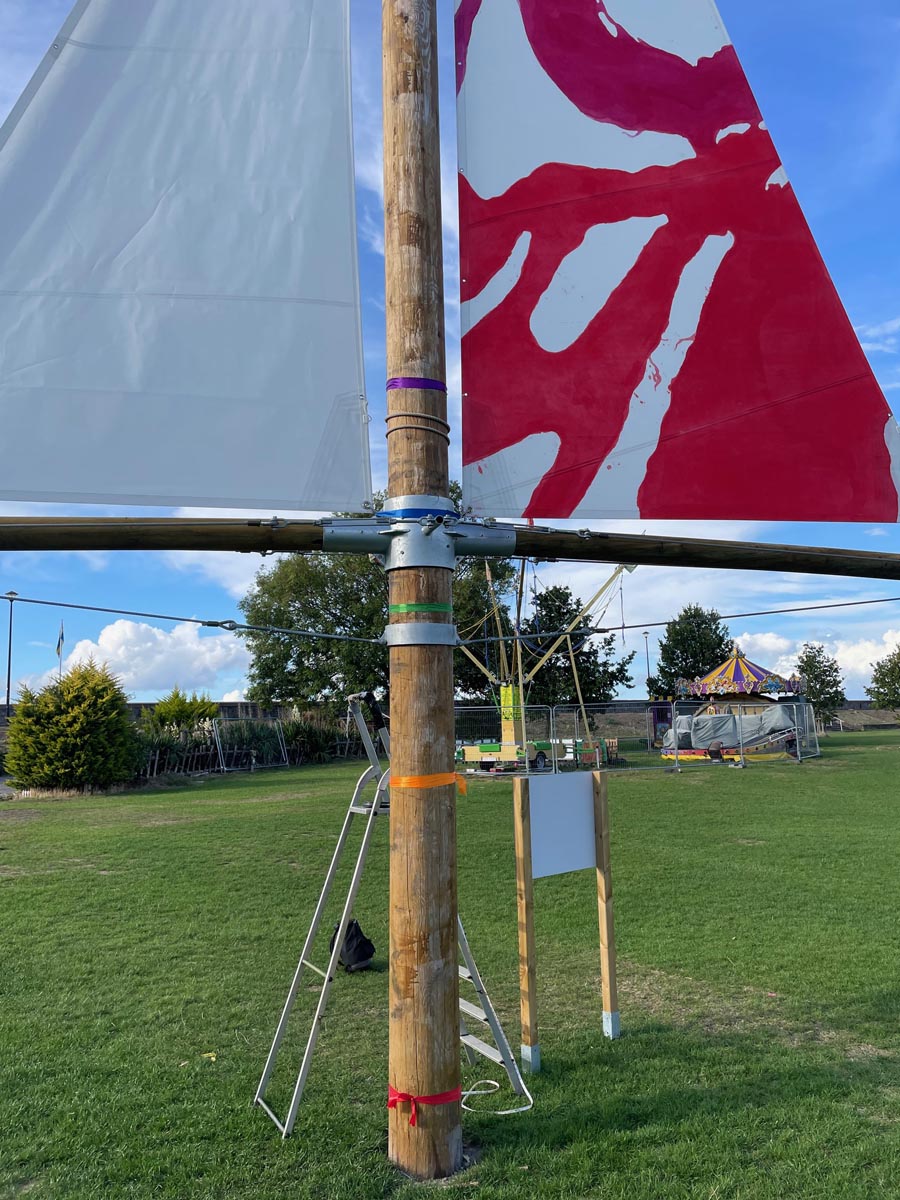
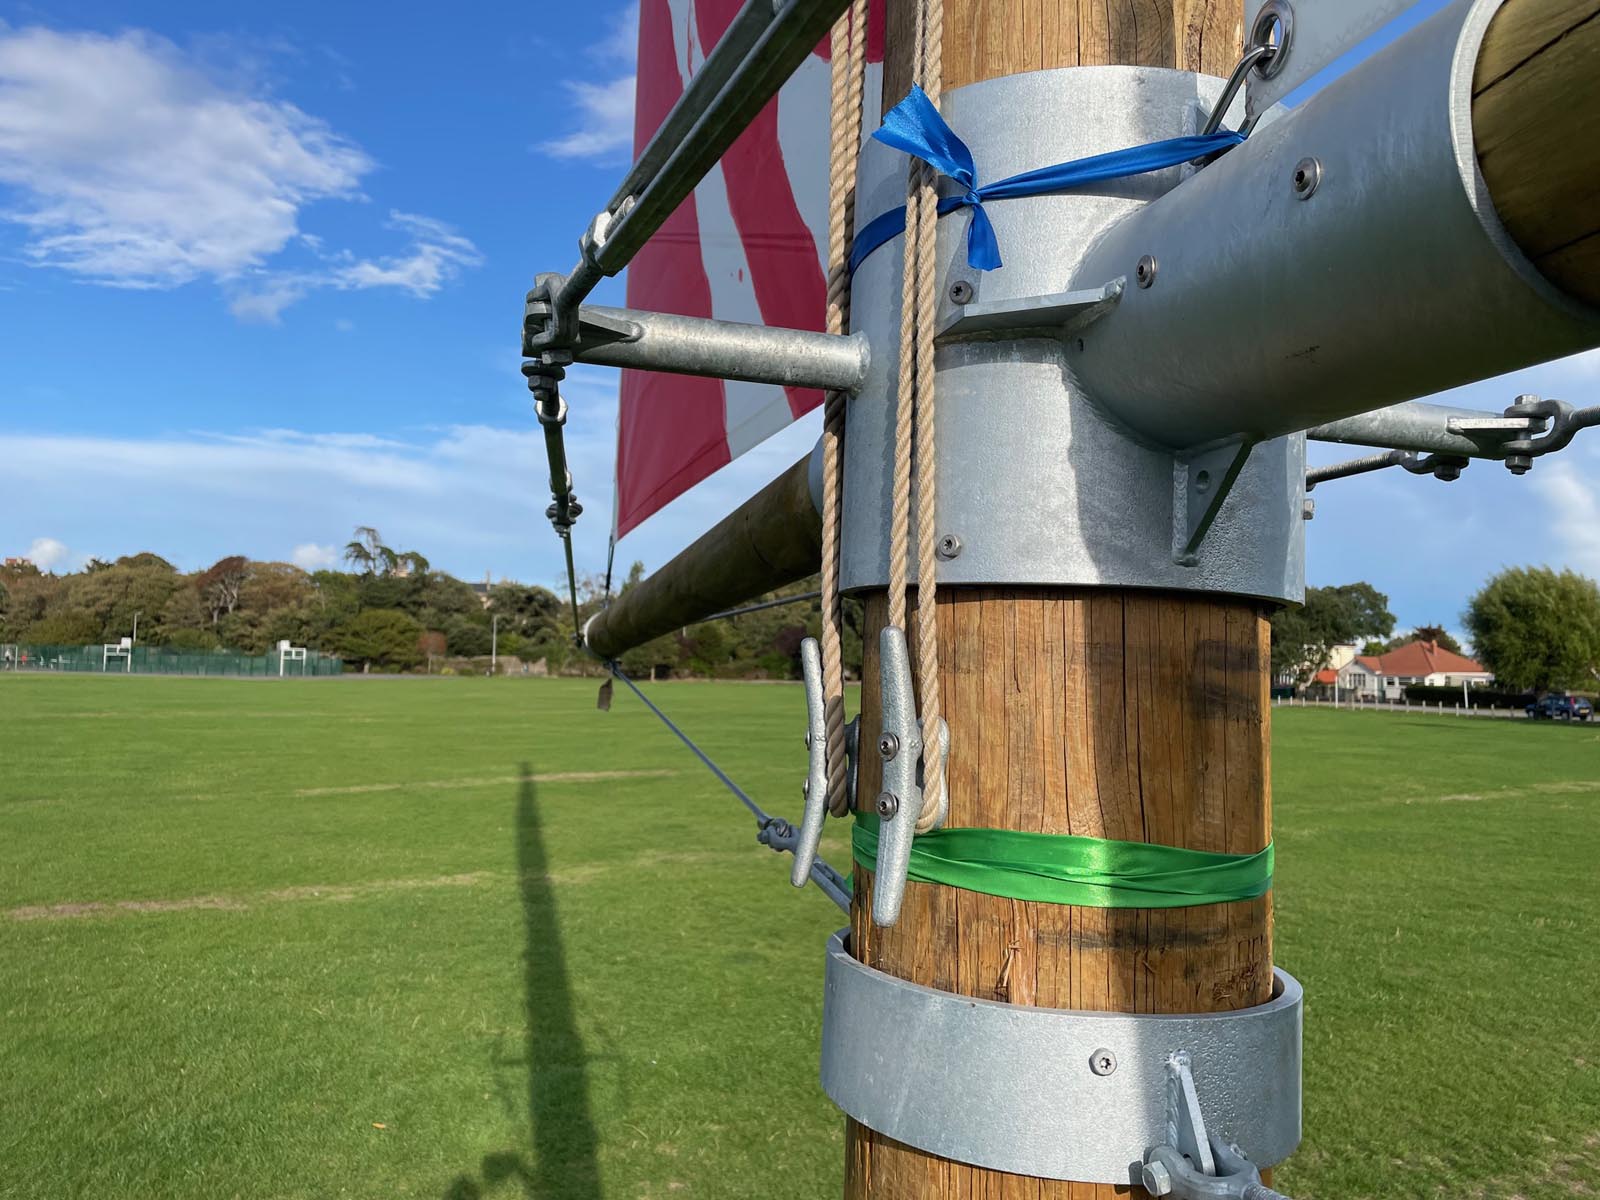
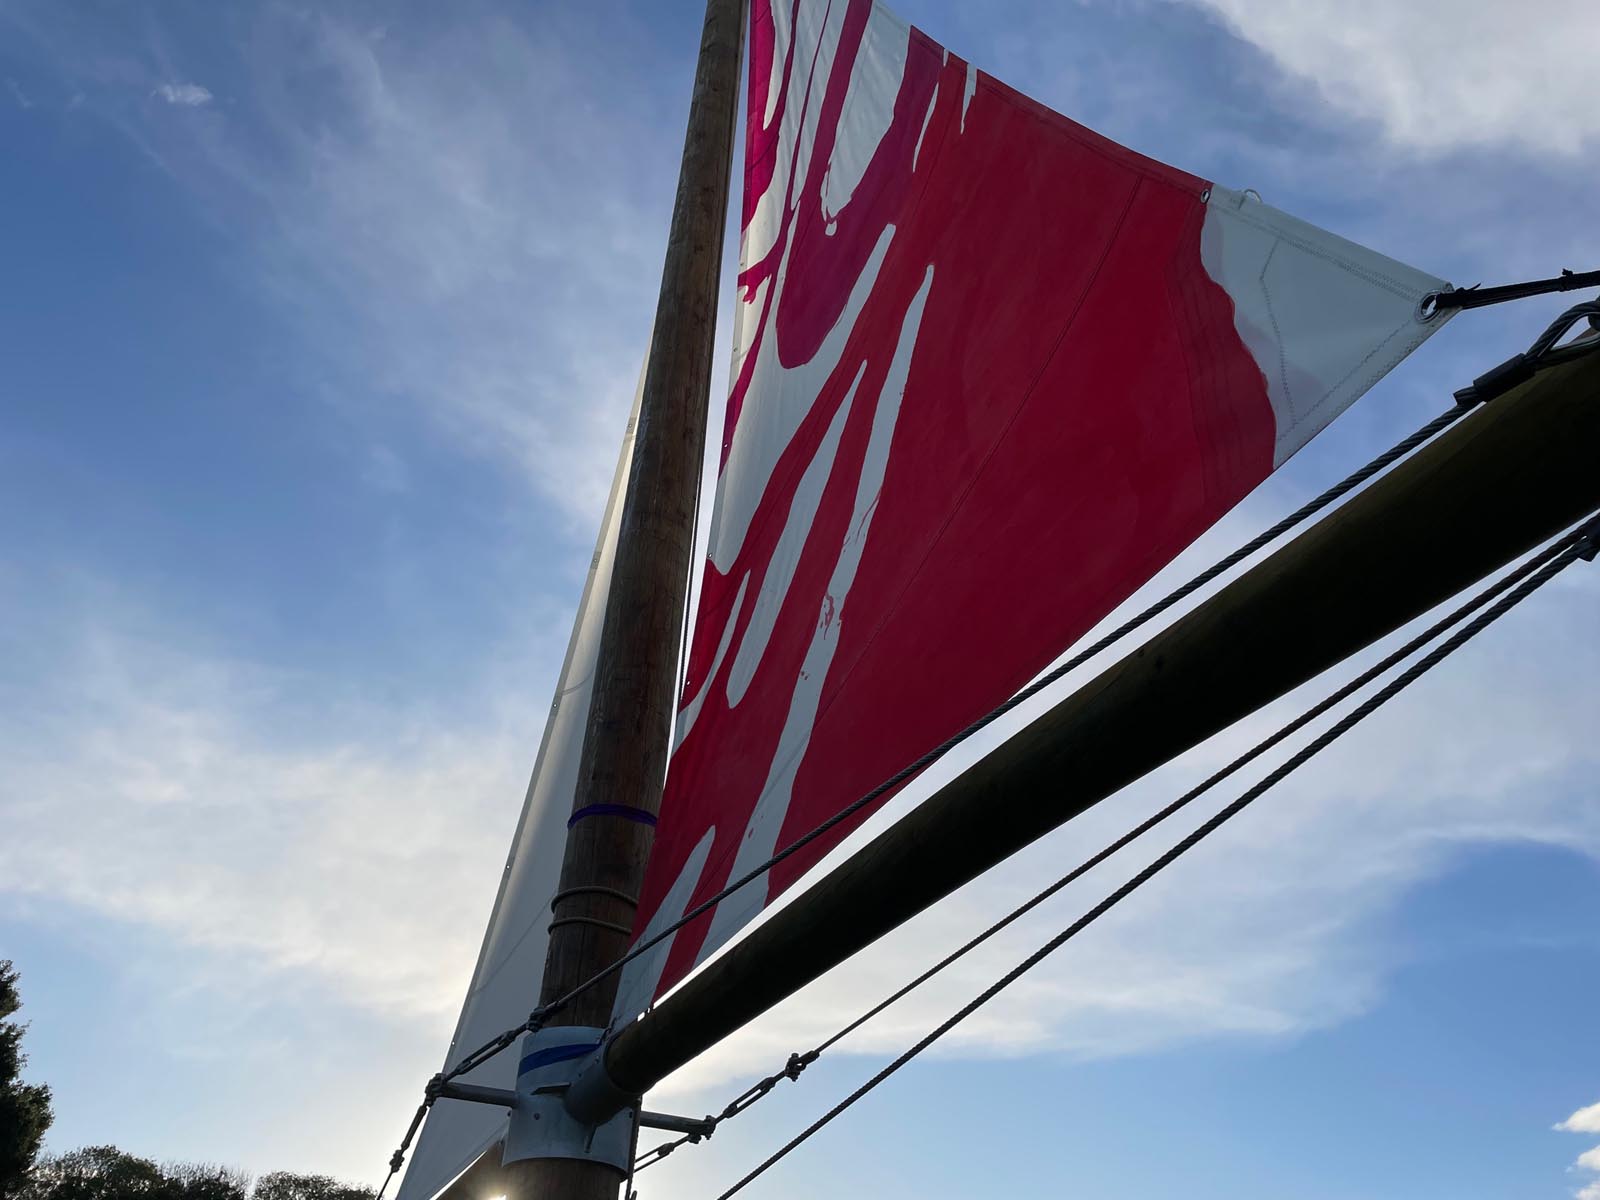
Perched on a high stepladder I tied coloured ribbons around the mast as various specific heights according recorded and predicted water levels. This turned the mast into a giant flood gauge, marking past, present and future sea levels in real space.
Perched on high stepladder I tied coloured ribbons around the mast as various specific heights. This turned the mast into a giant flood gauge, marking past, present and future sea levels.
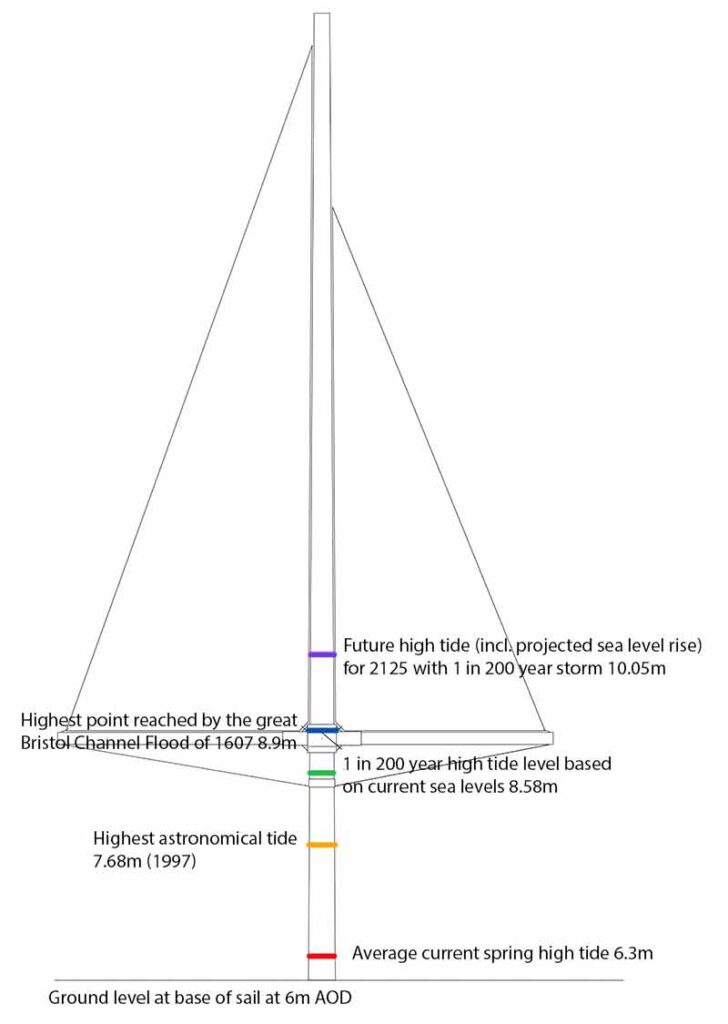
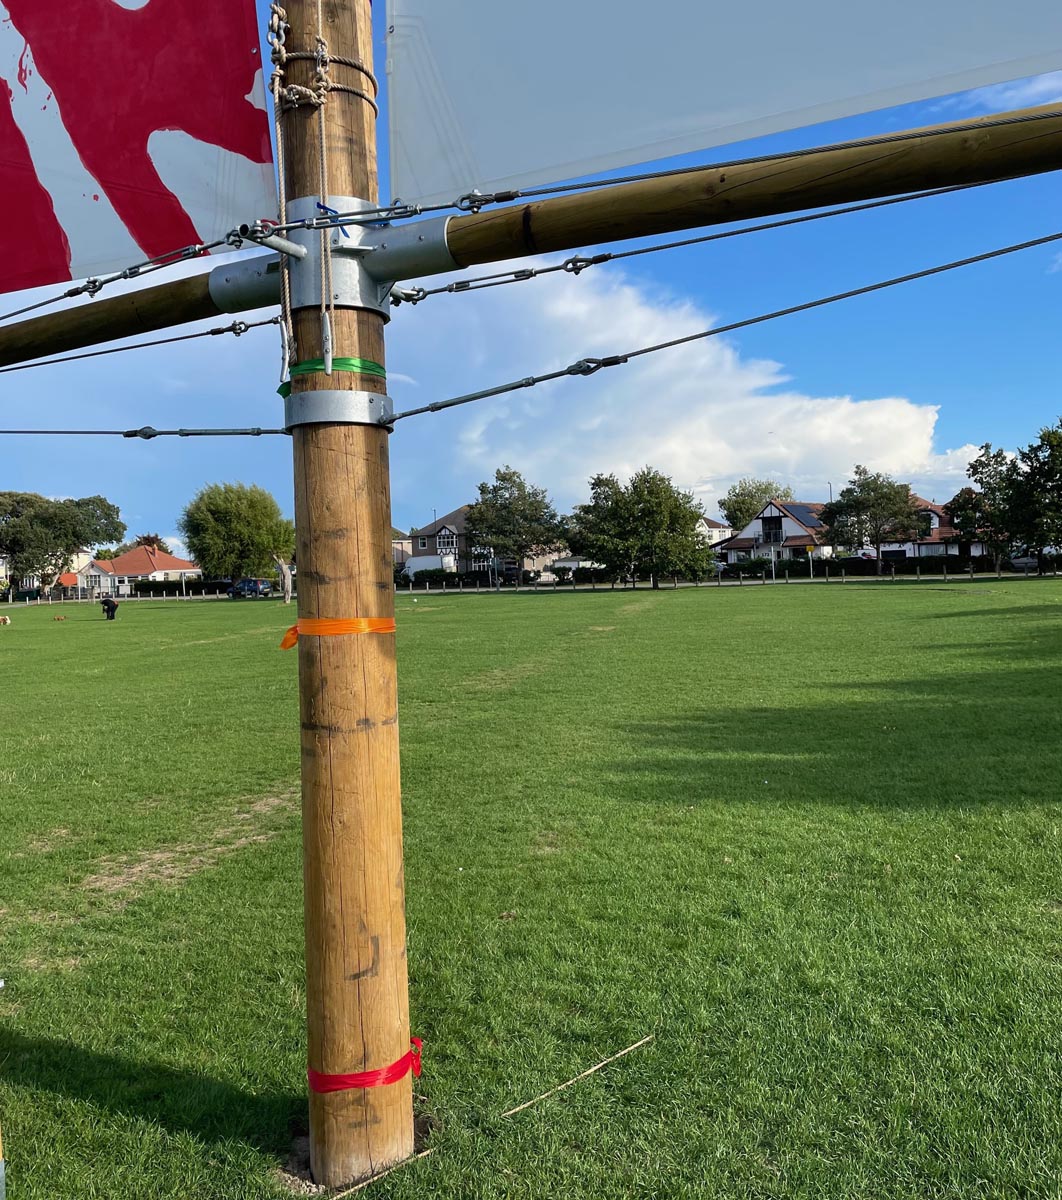
The bit of the park where the sail is installed is 6m above mean sea level – what is known as Above Ordnance Datum (AOD). This is the mean sea level taken from measurements over a period of time in Newlyn, Cornwall that is used to measure height across the UK.
Knowing the height of the base of the mast was 6m AOD, using LiDAR mapping, it was possible to then measure up the mast and tie the ribbons to it at the height of various sea level scenarios.
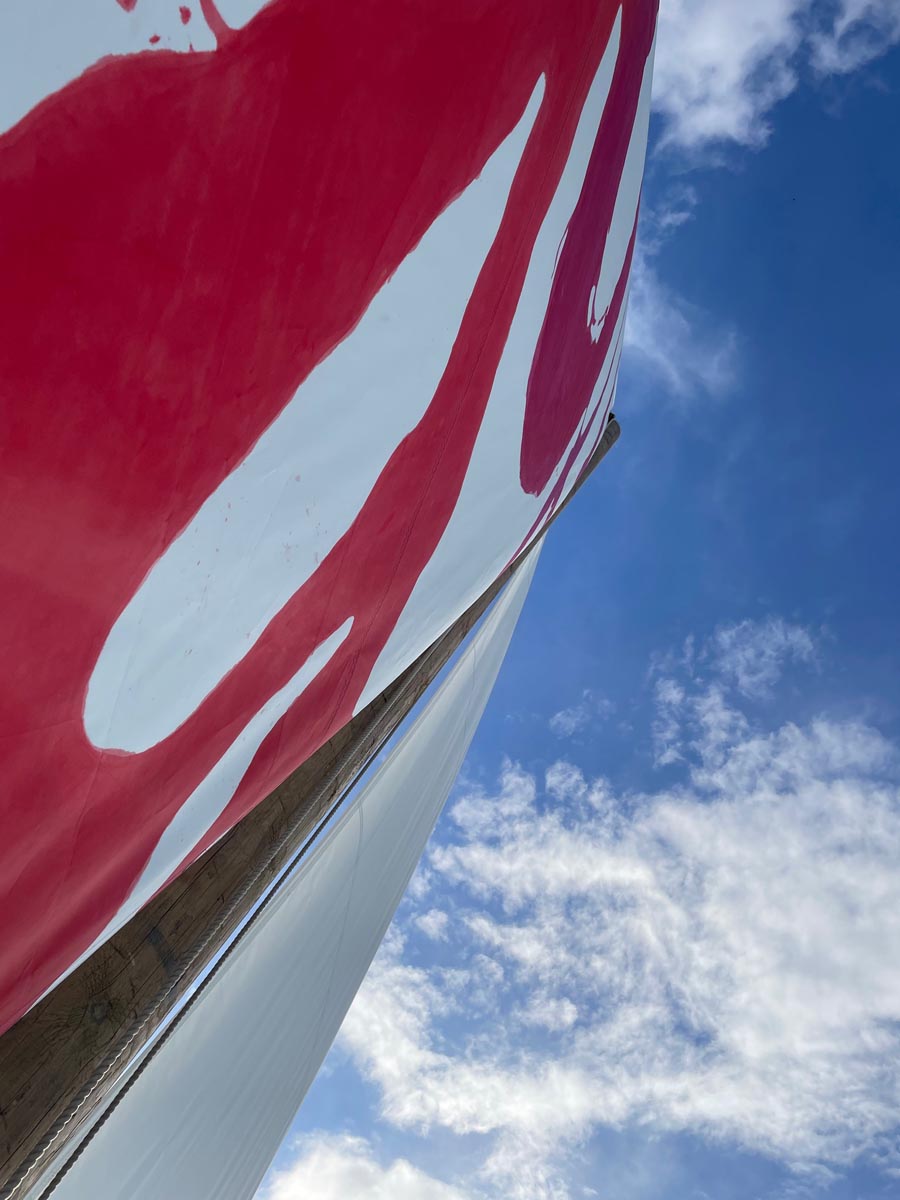
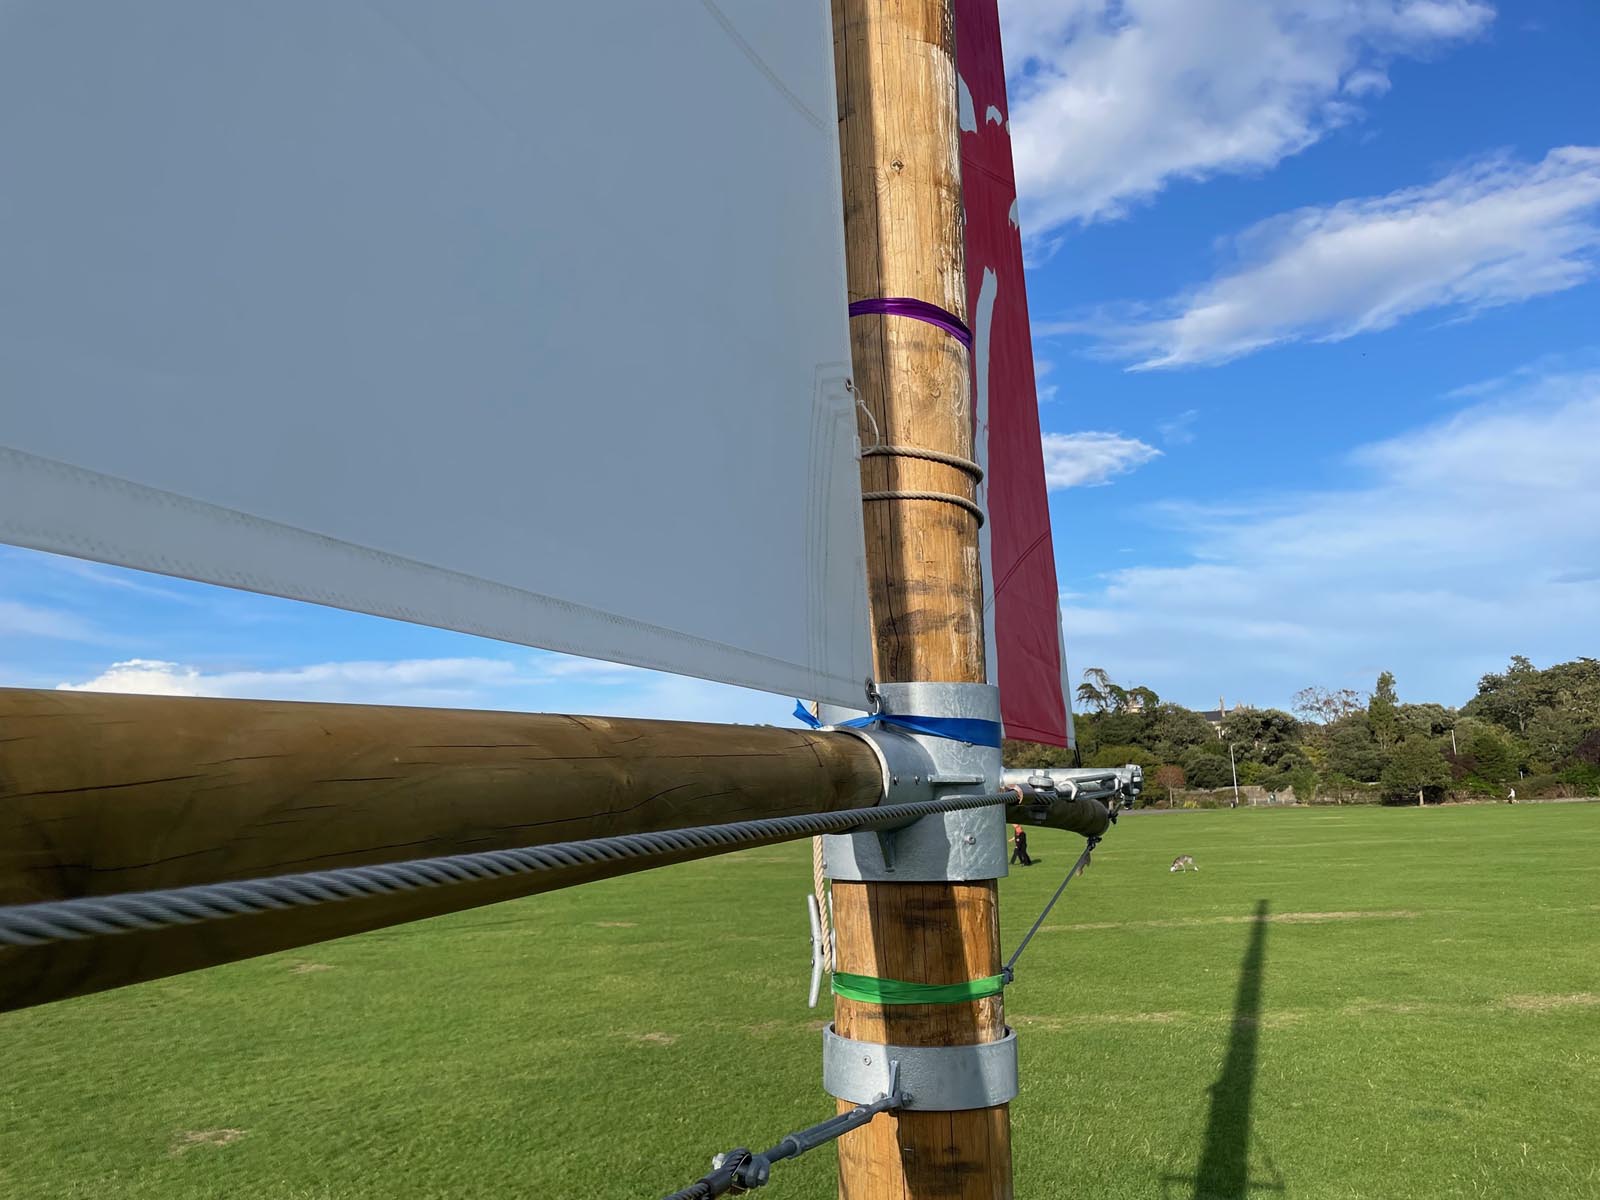
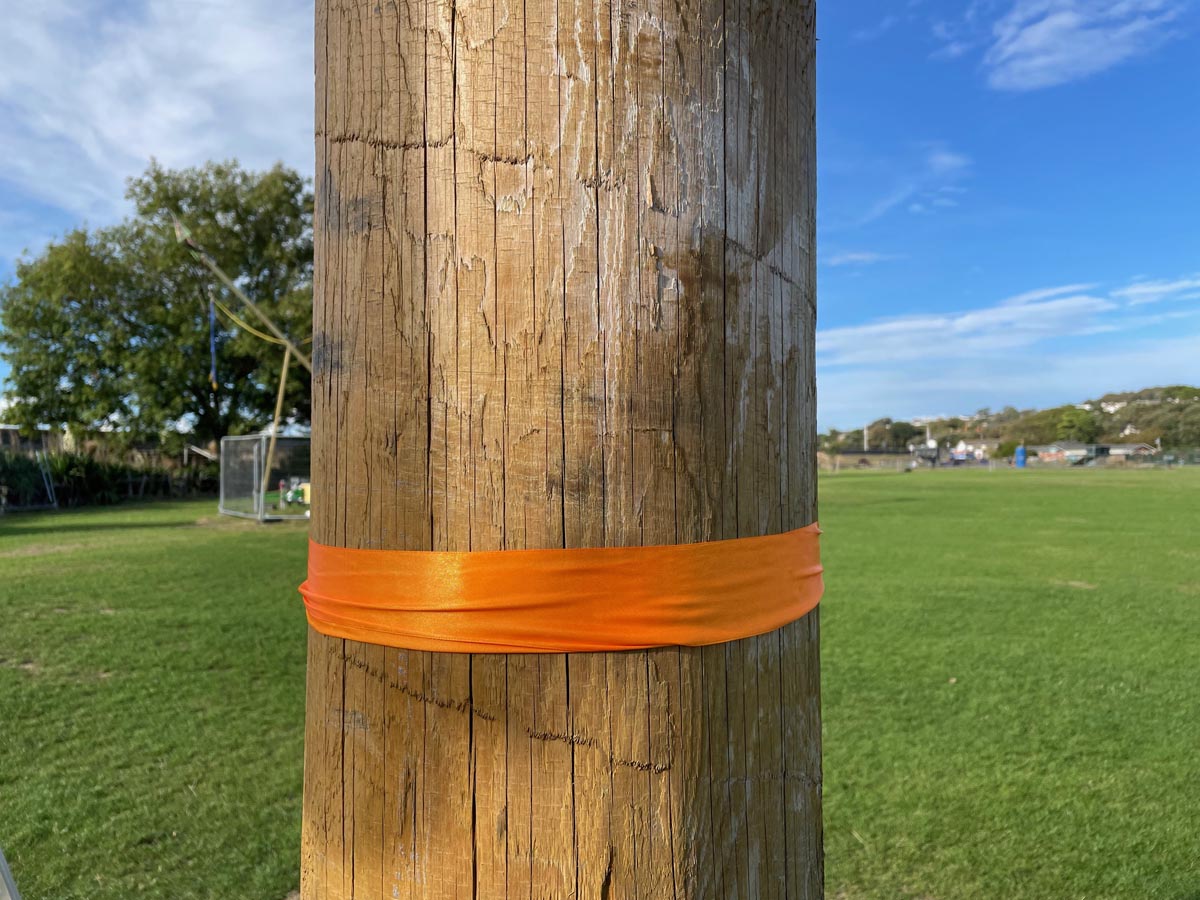
The first red ribbon, just a foot above the base of the mast shows the highest average spring high tide. This shows that the sea would regularly flood the Salthouse Fields on a spring high tide if the coast wasn’t protected by a high sea wall.
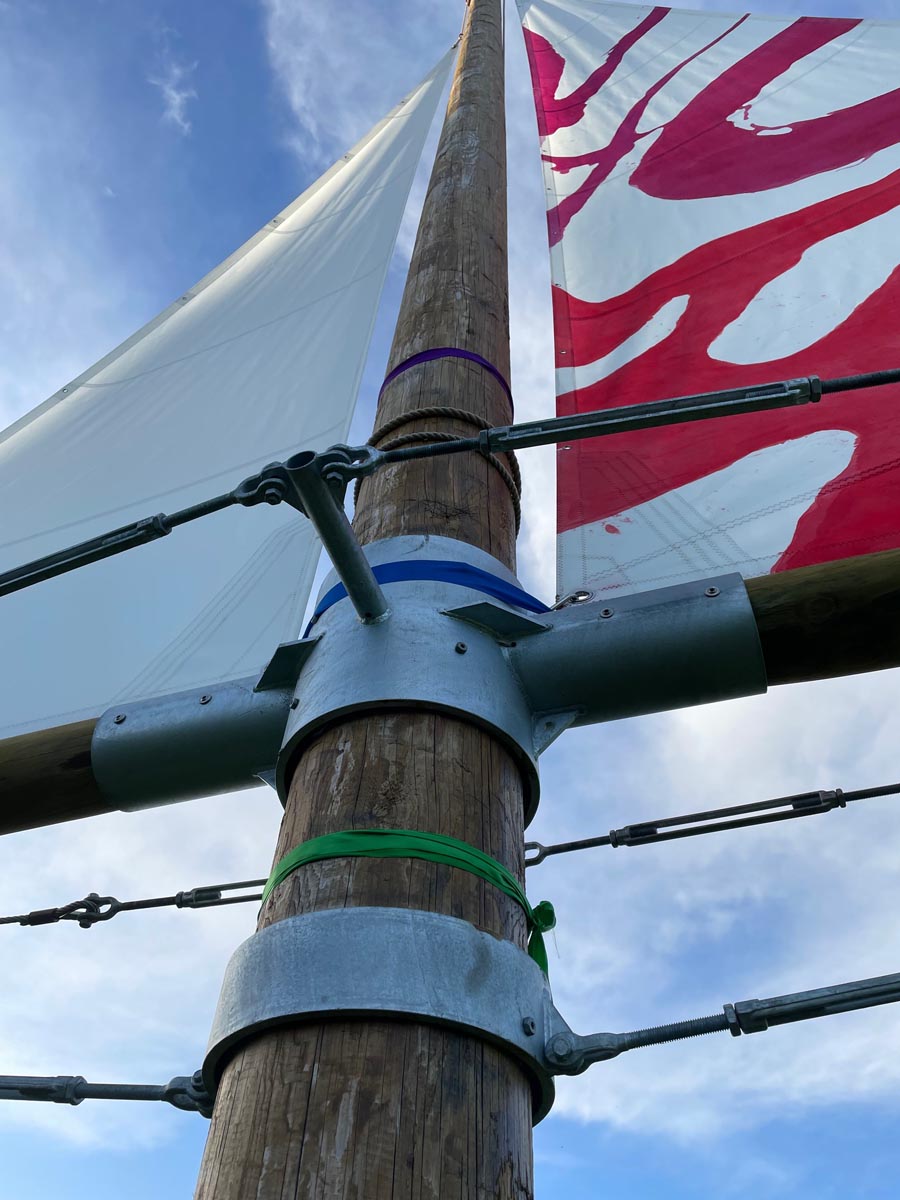
Much higher up, the yellow ribbon shows the highest recorded astronomical tide (a tide only caused by the gravity of the moon and sun and that isn’t increased by in height by the weather – a storm for instance can heap the water up making the tide even higher)
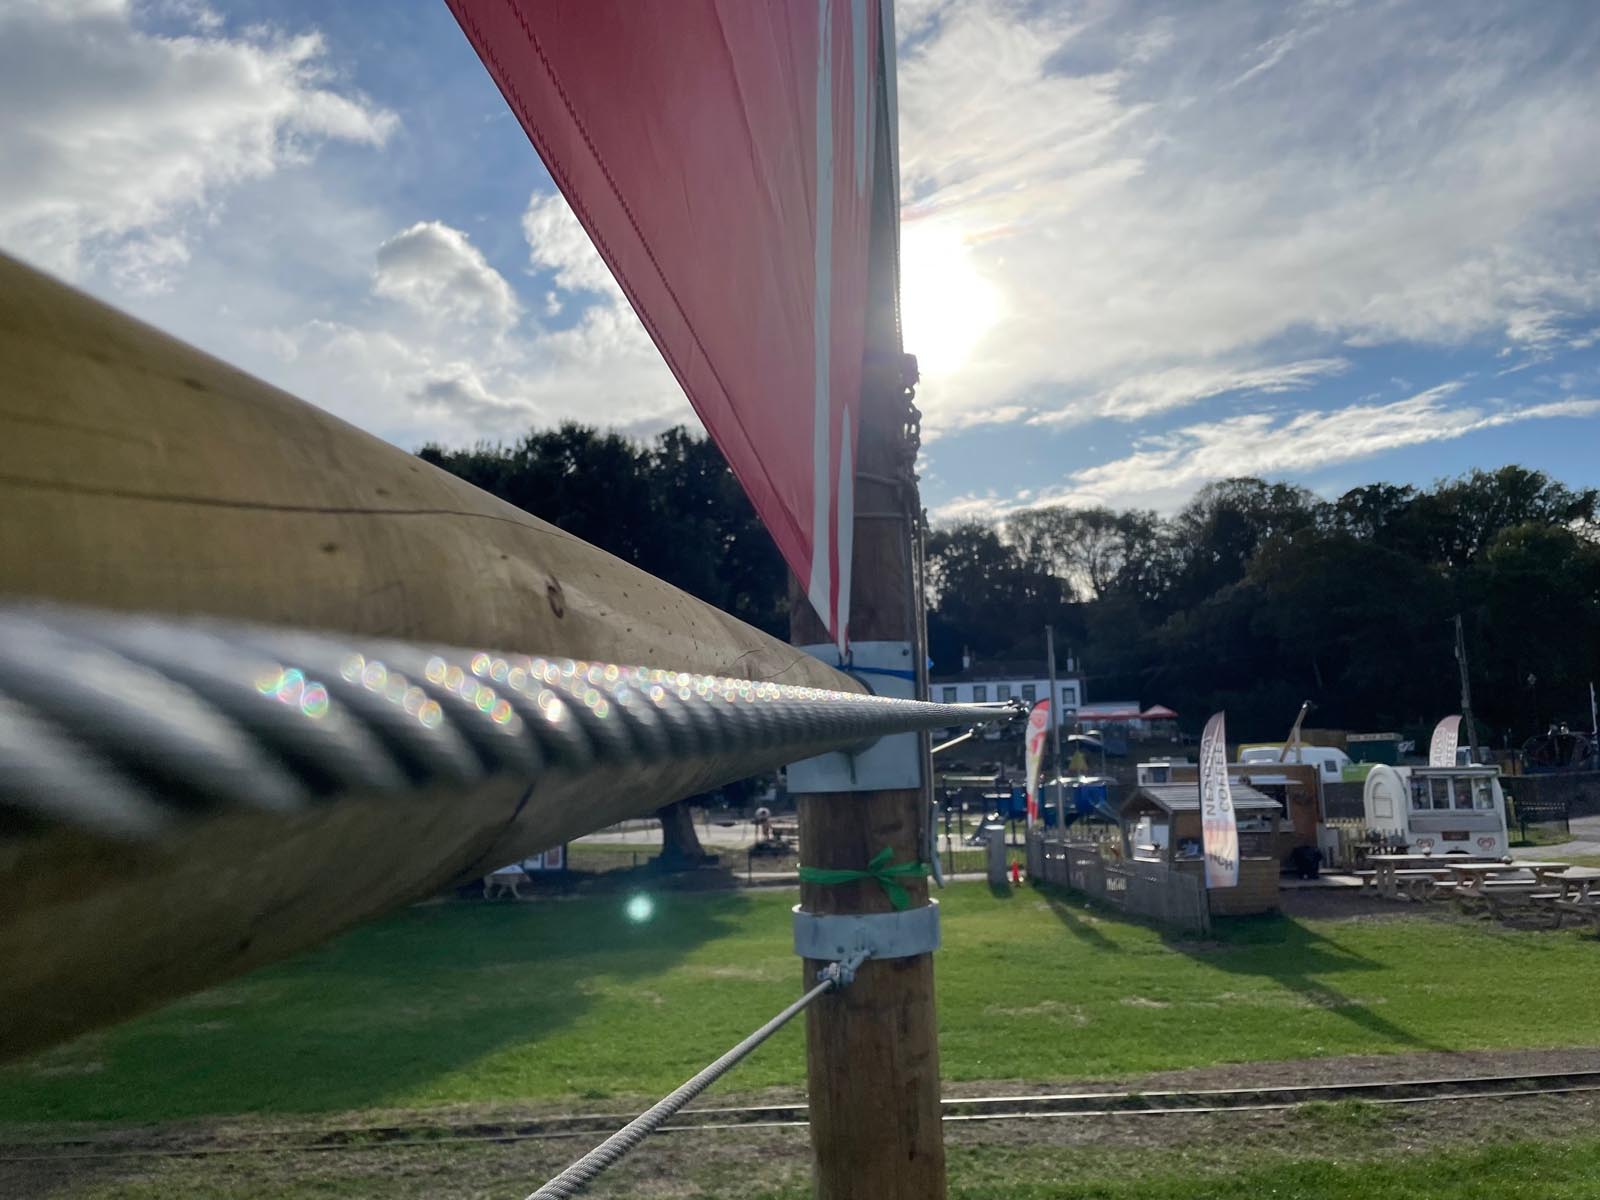
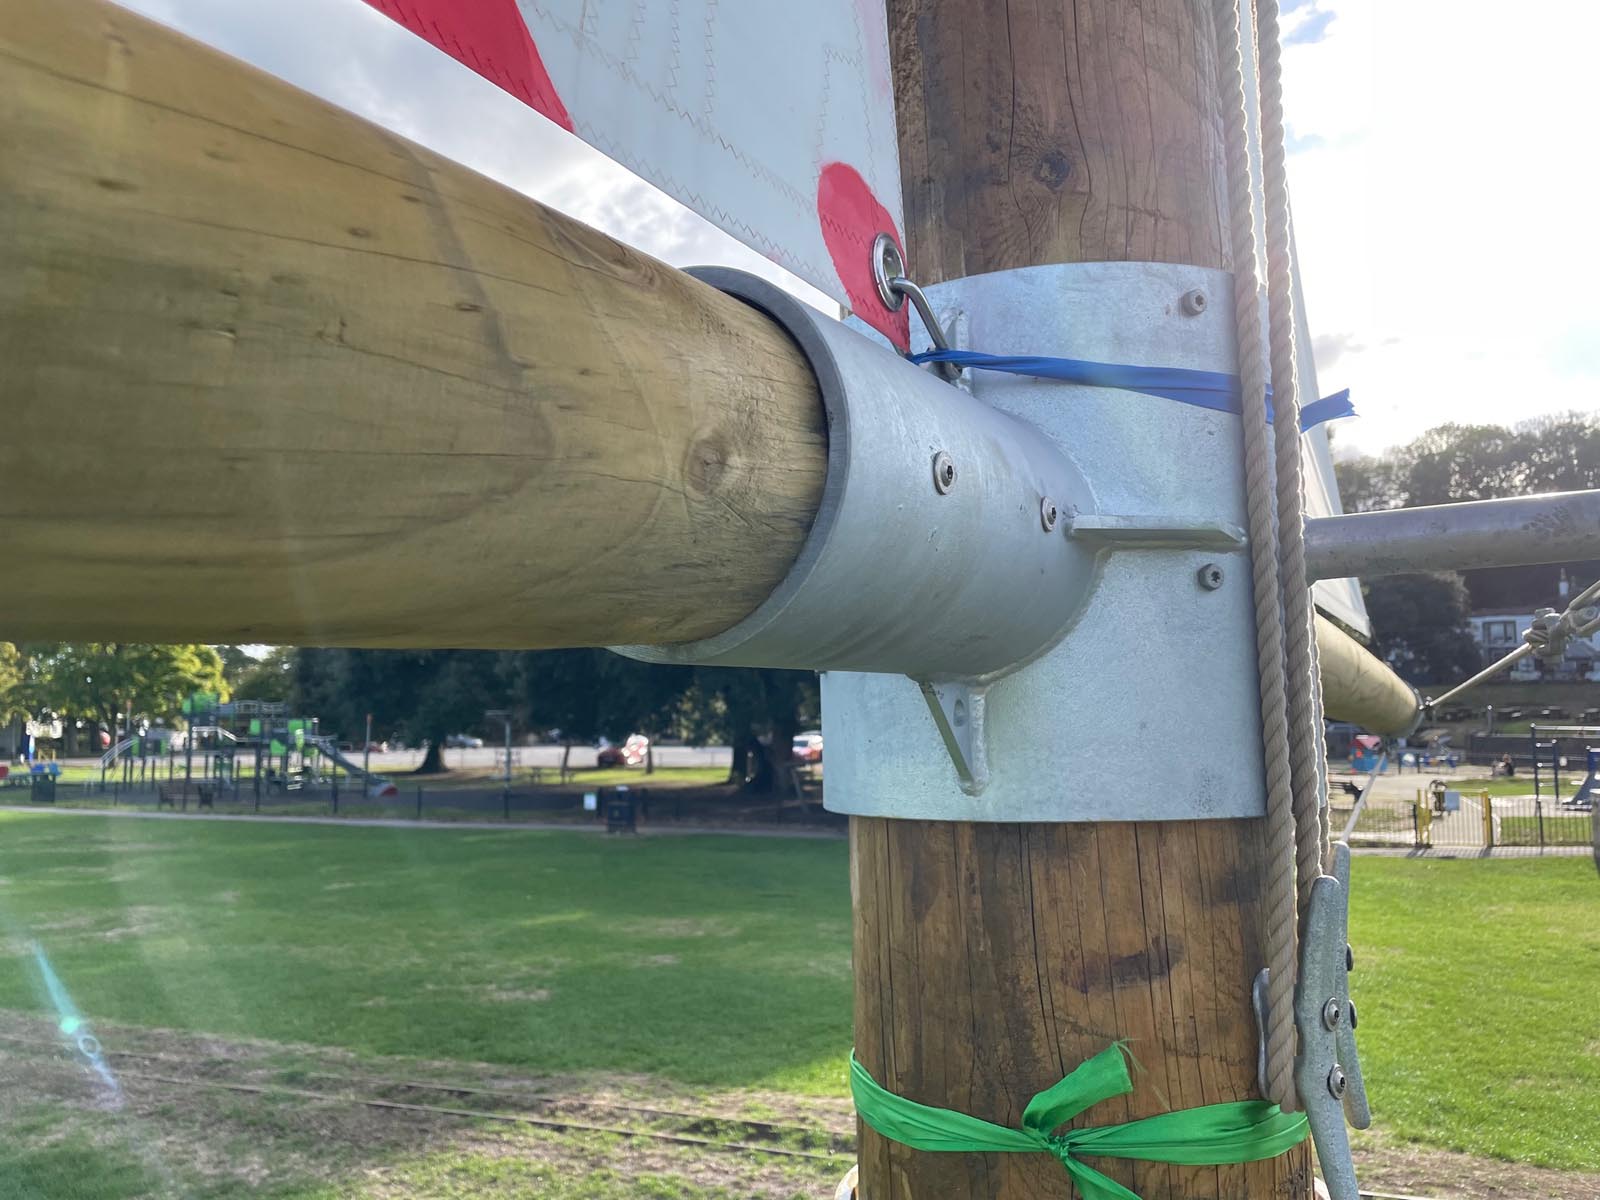
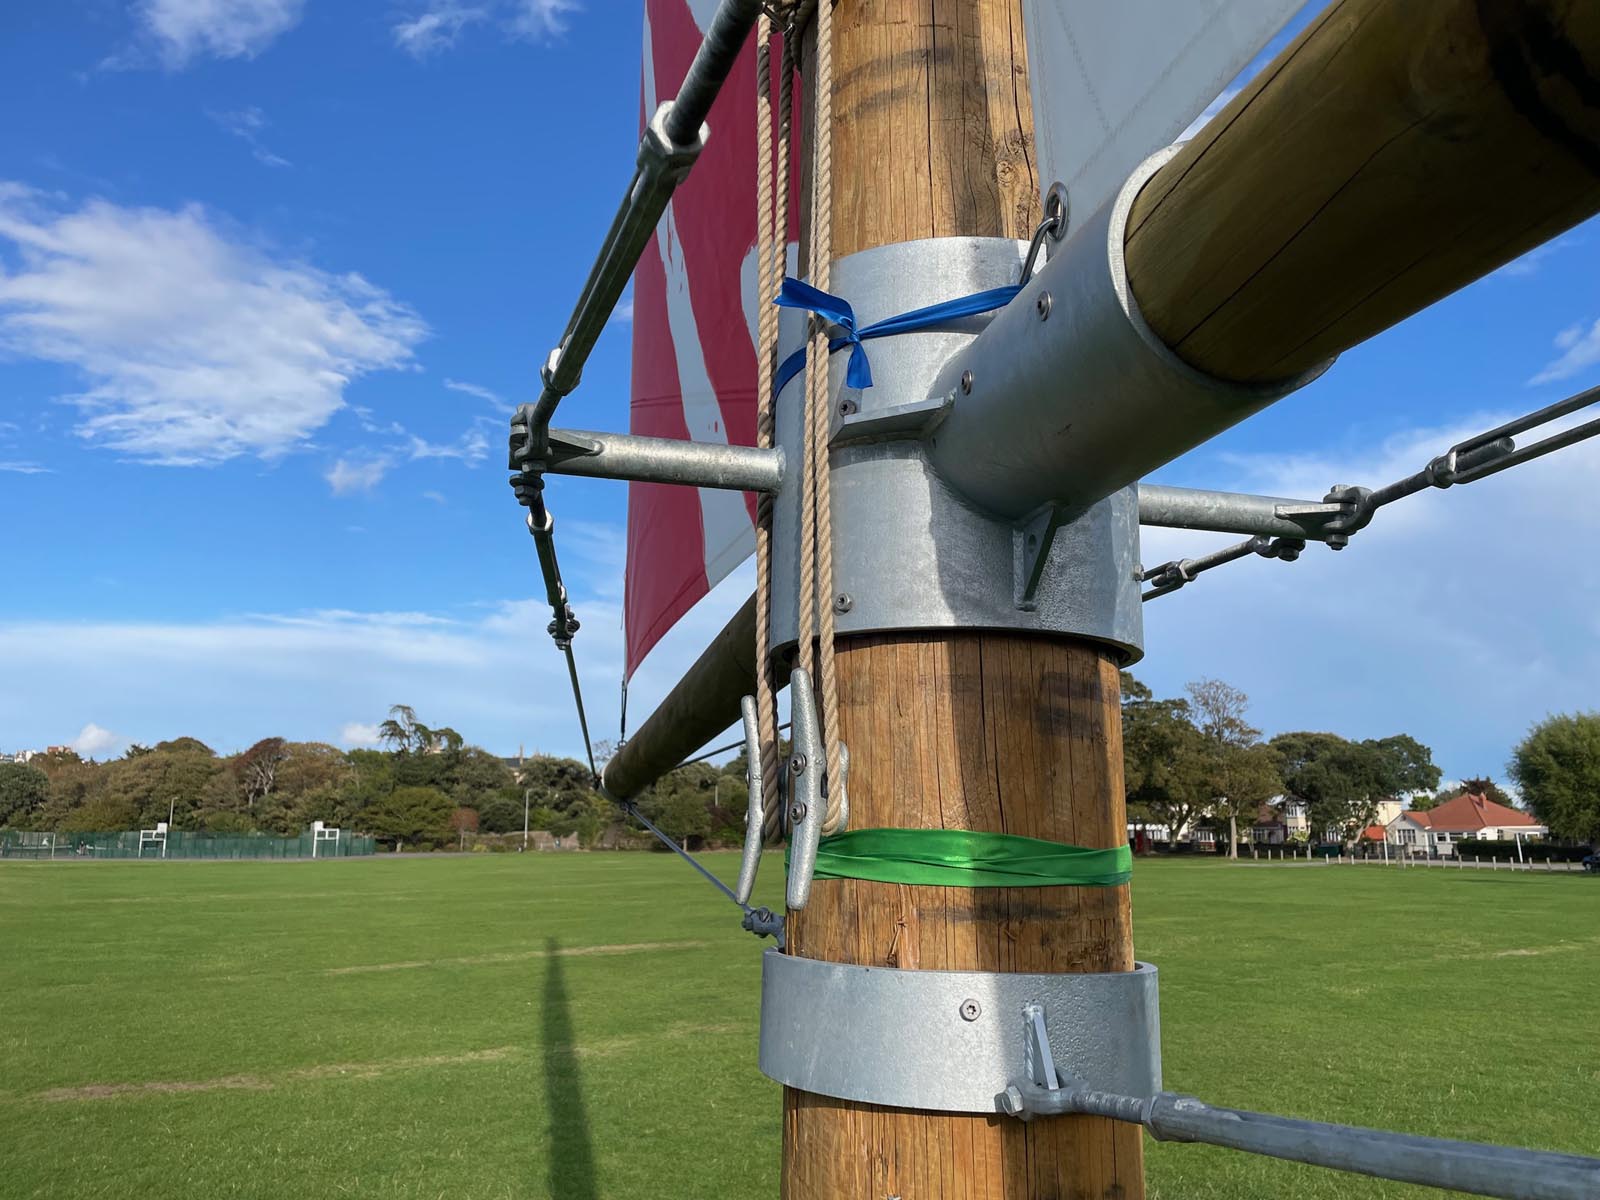
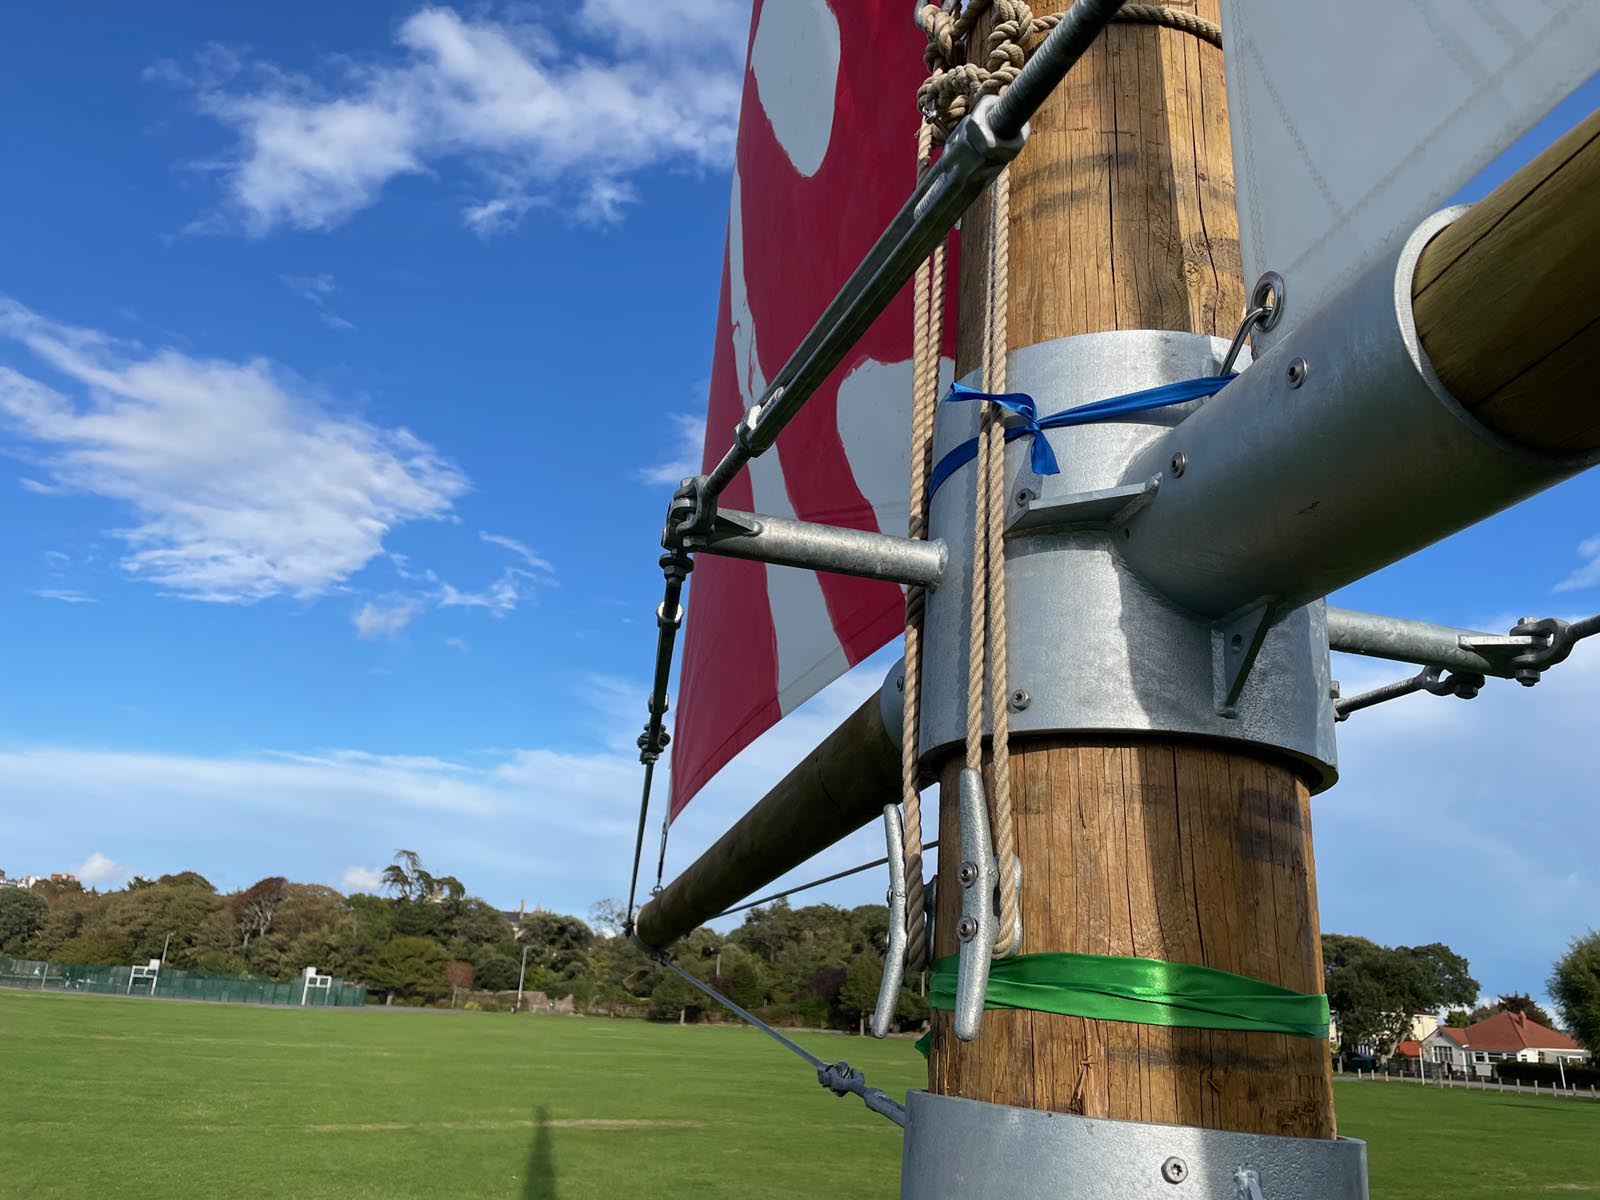
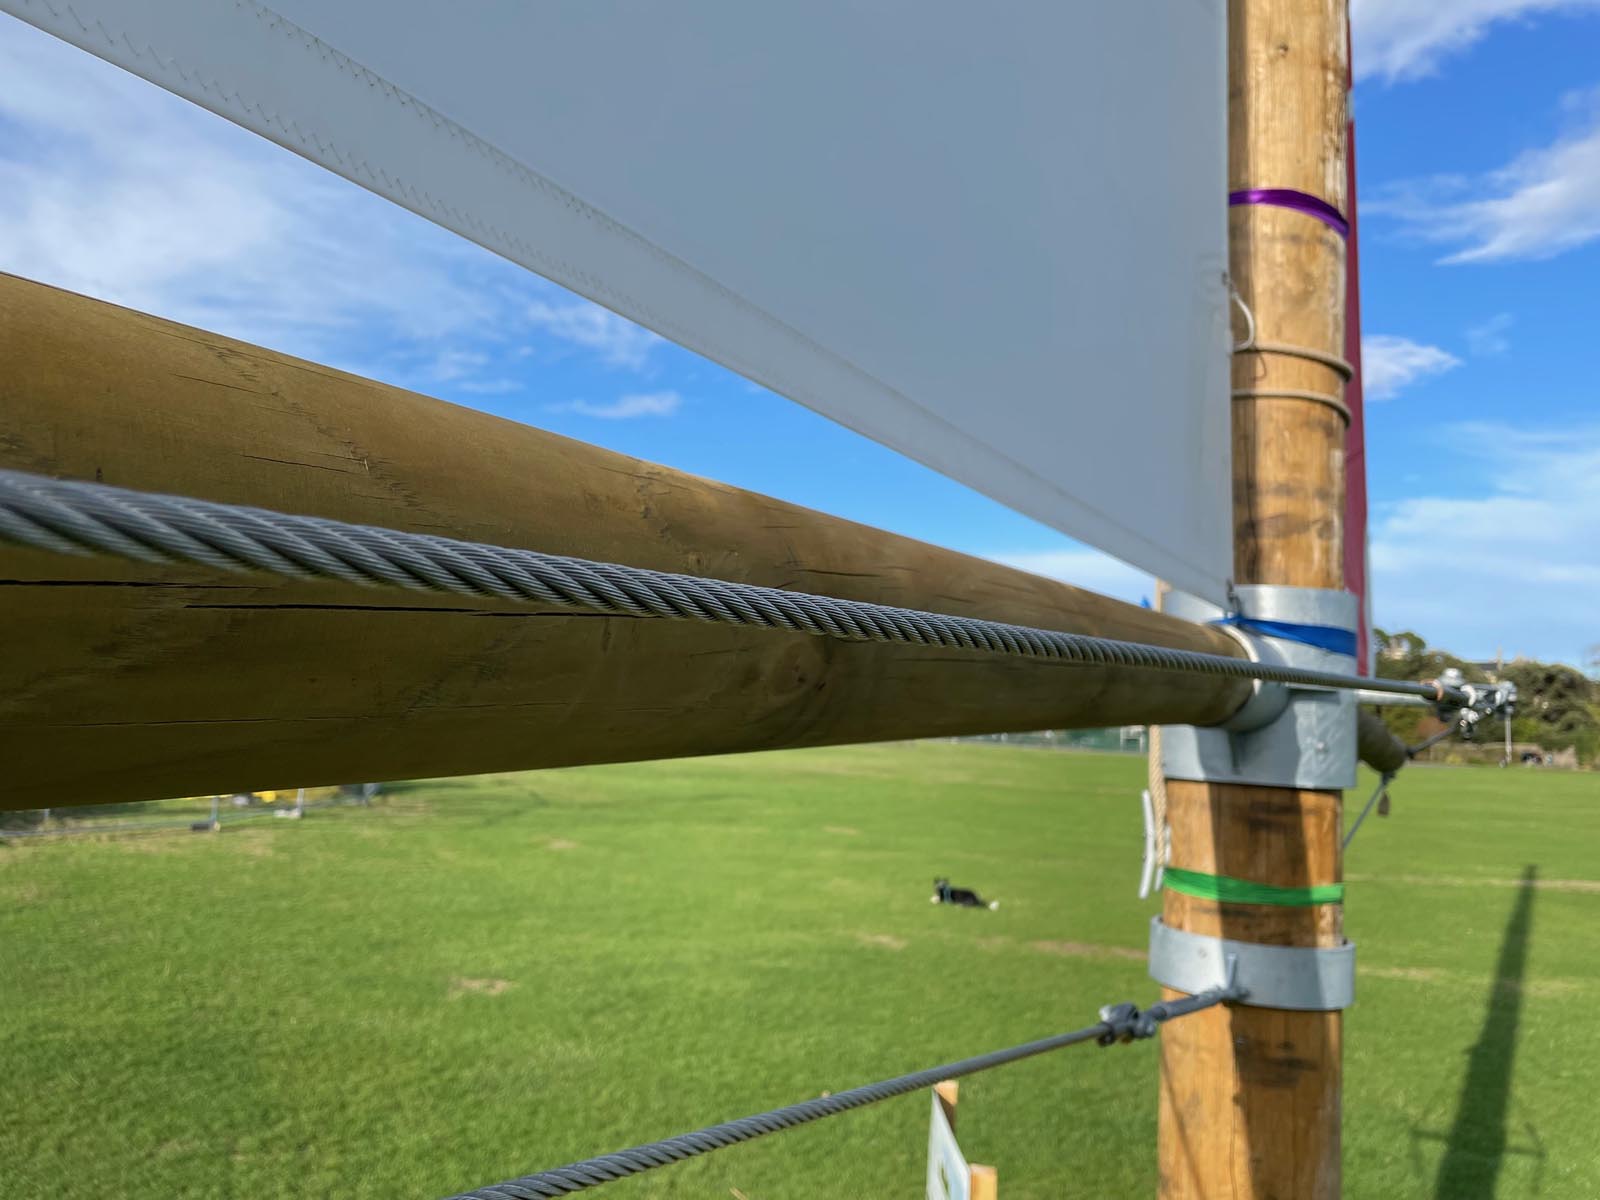
The green ribbon further up still represents how high the water would get if a particularly big storm piled up the water adding to the tide, based on present day sea levels. This is predicted to happen very rarely with the chance being once every 200 years. Climate change though is making very rare events more frequent so that 1 in 200 year chance may be out of date!
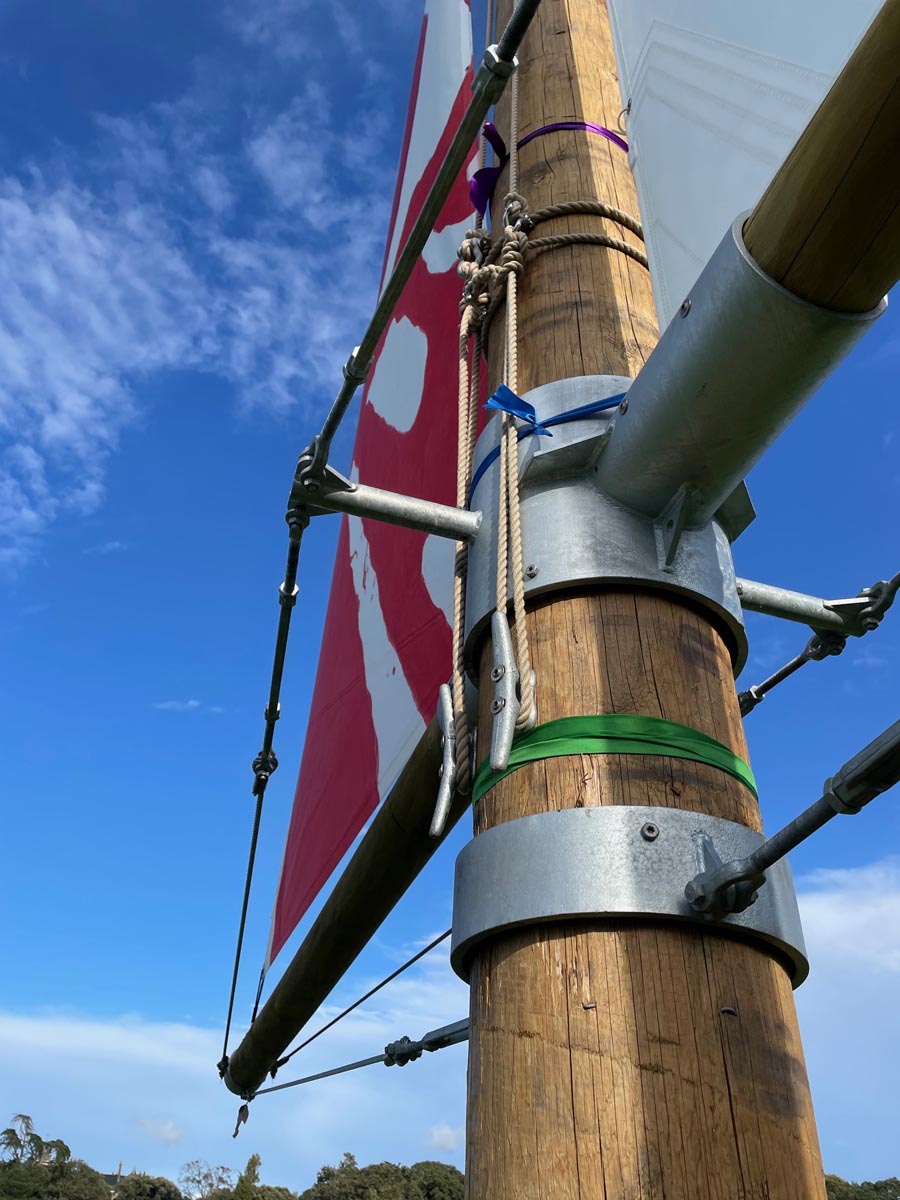
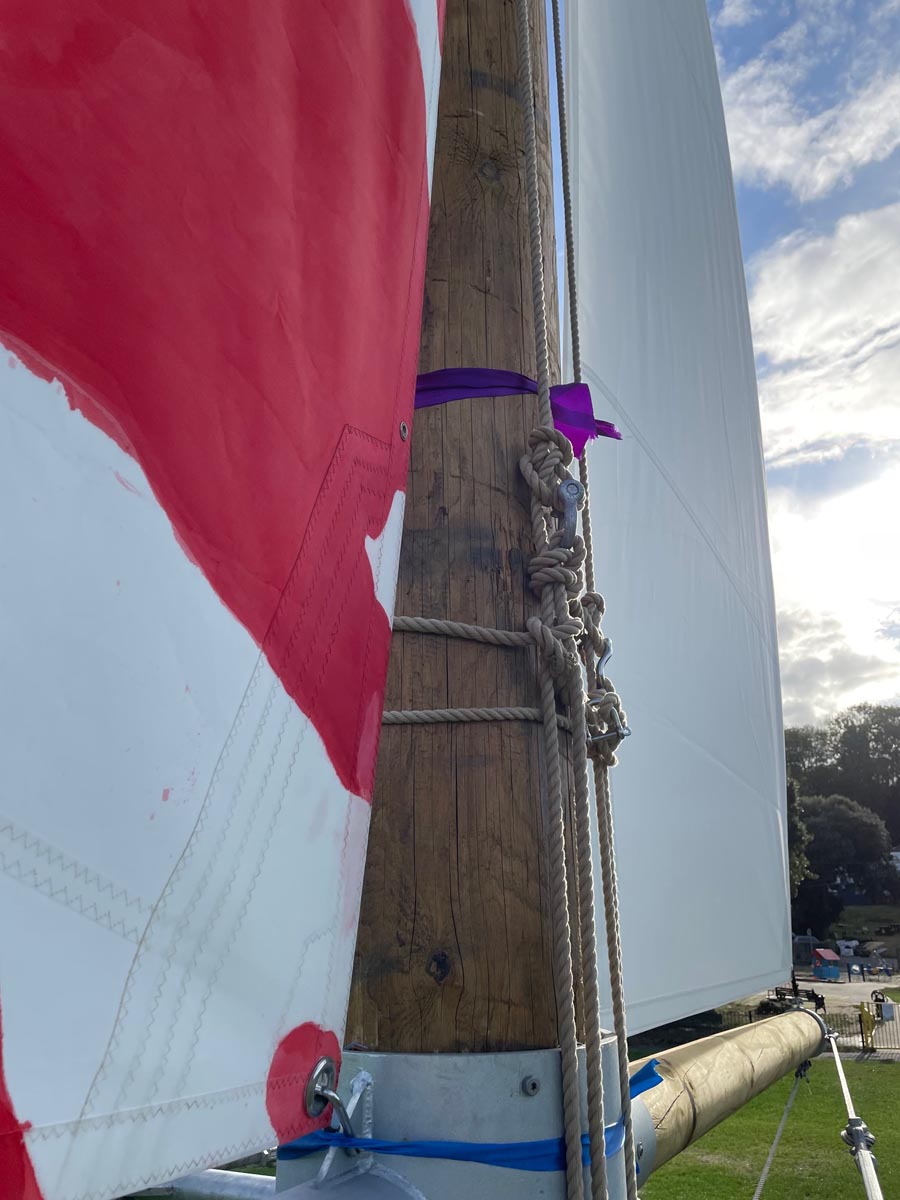
Going higher, the blue ribbon, up above the level of the booms represents a huge tidal flood that actually happened. In 1607 a massive storm surge (here the water is piled up by the wind) on top of a very high tide inundated the Somerset and North Somerset Levels as well large areas of south Wales drowning more than 2000 people. This catastrophic flood is marked on churches and other structures across the region. See the 1607 Bristol Channel Floods
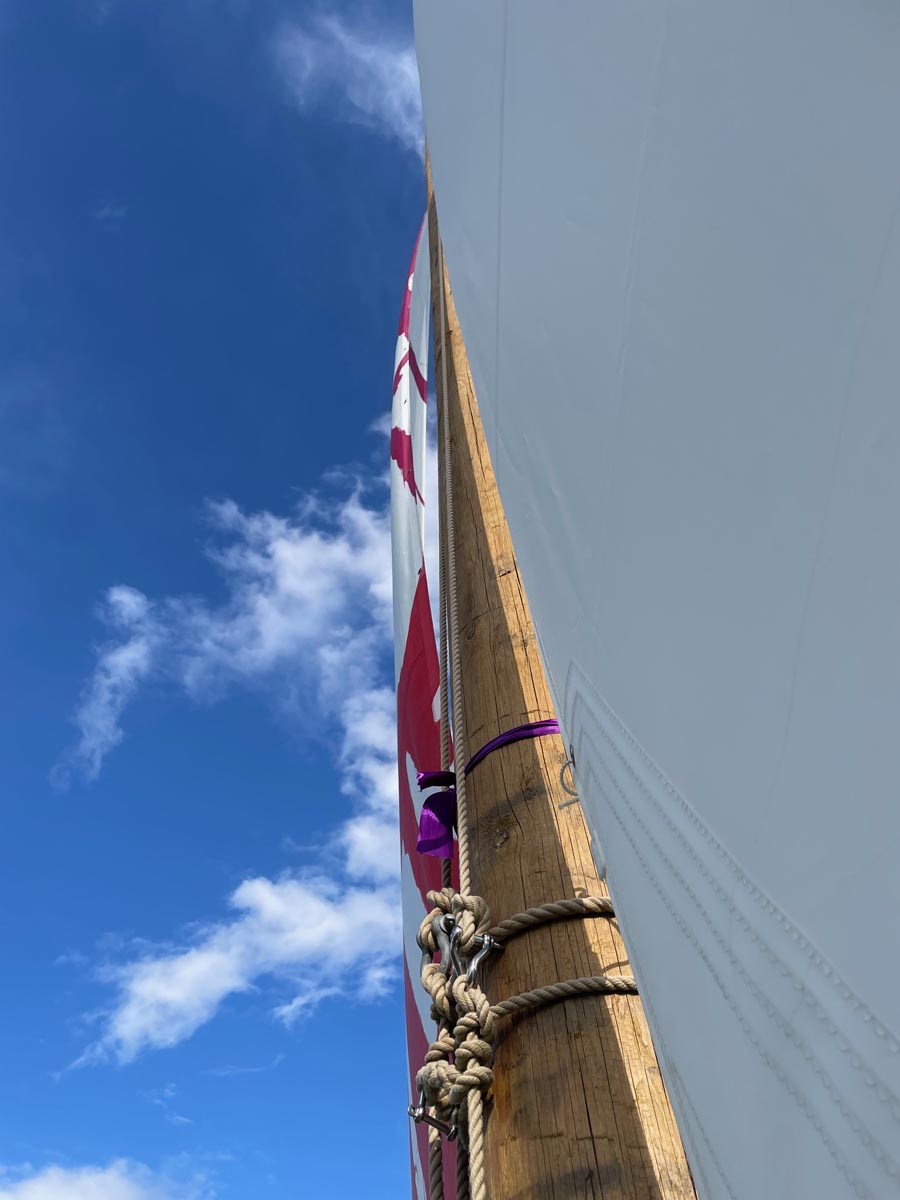
The final purple ribbon, much higher yet, shows how high the water could get in the future during a storm surge, taking in to account sea level rise. This would come over the top of the highest flood defences currently protecting Clevedon and the whole of the Somerset coast, dwarfing even the catastrophic 1607 floods.